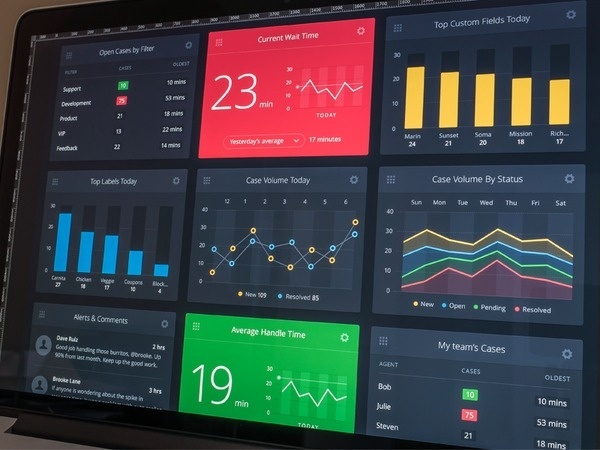
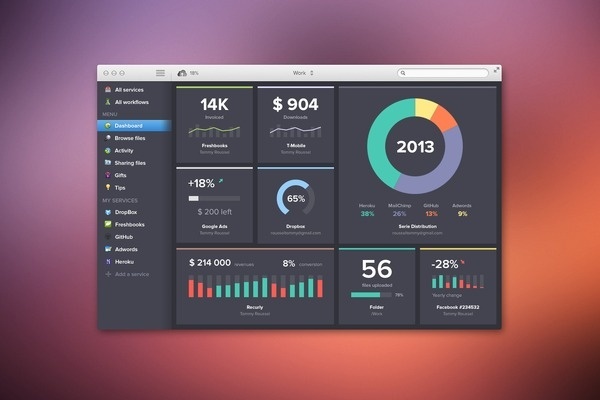
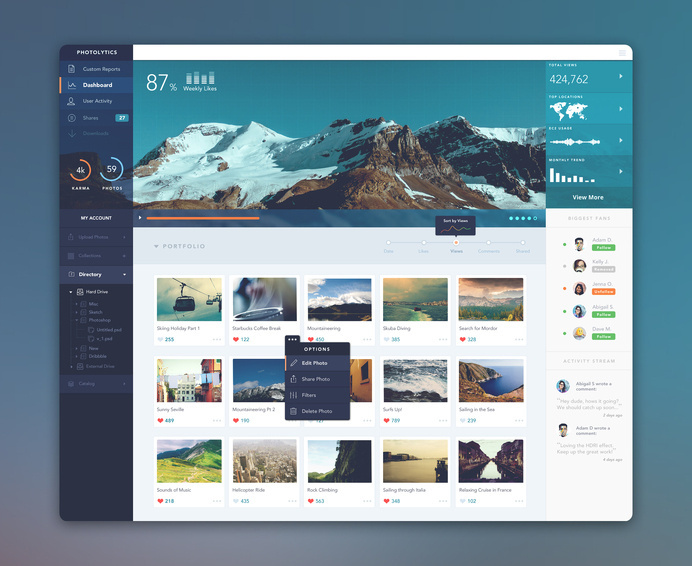
Dashboard
Dahboard design
We curate topical collections around design to inspire you in the design process.
This constantly-updated list featuring what find on the always-fresh Muzli inventory.
Last update: 7/13/2025
Dahboard design

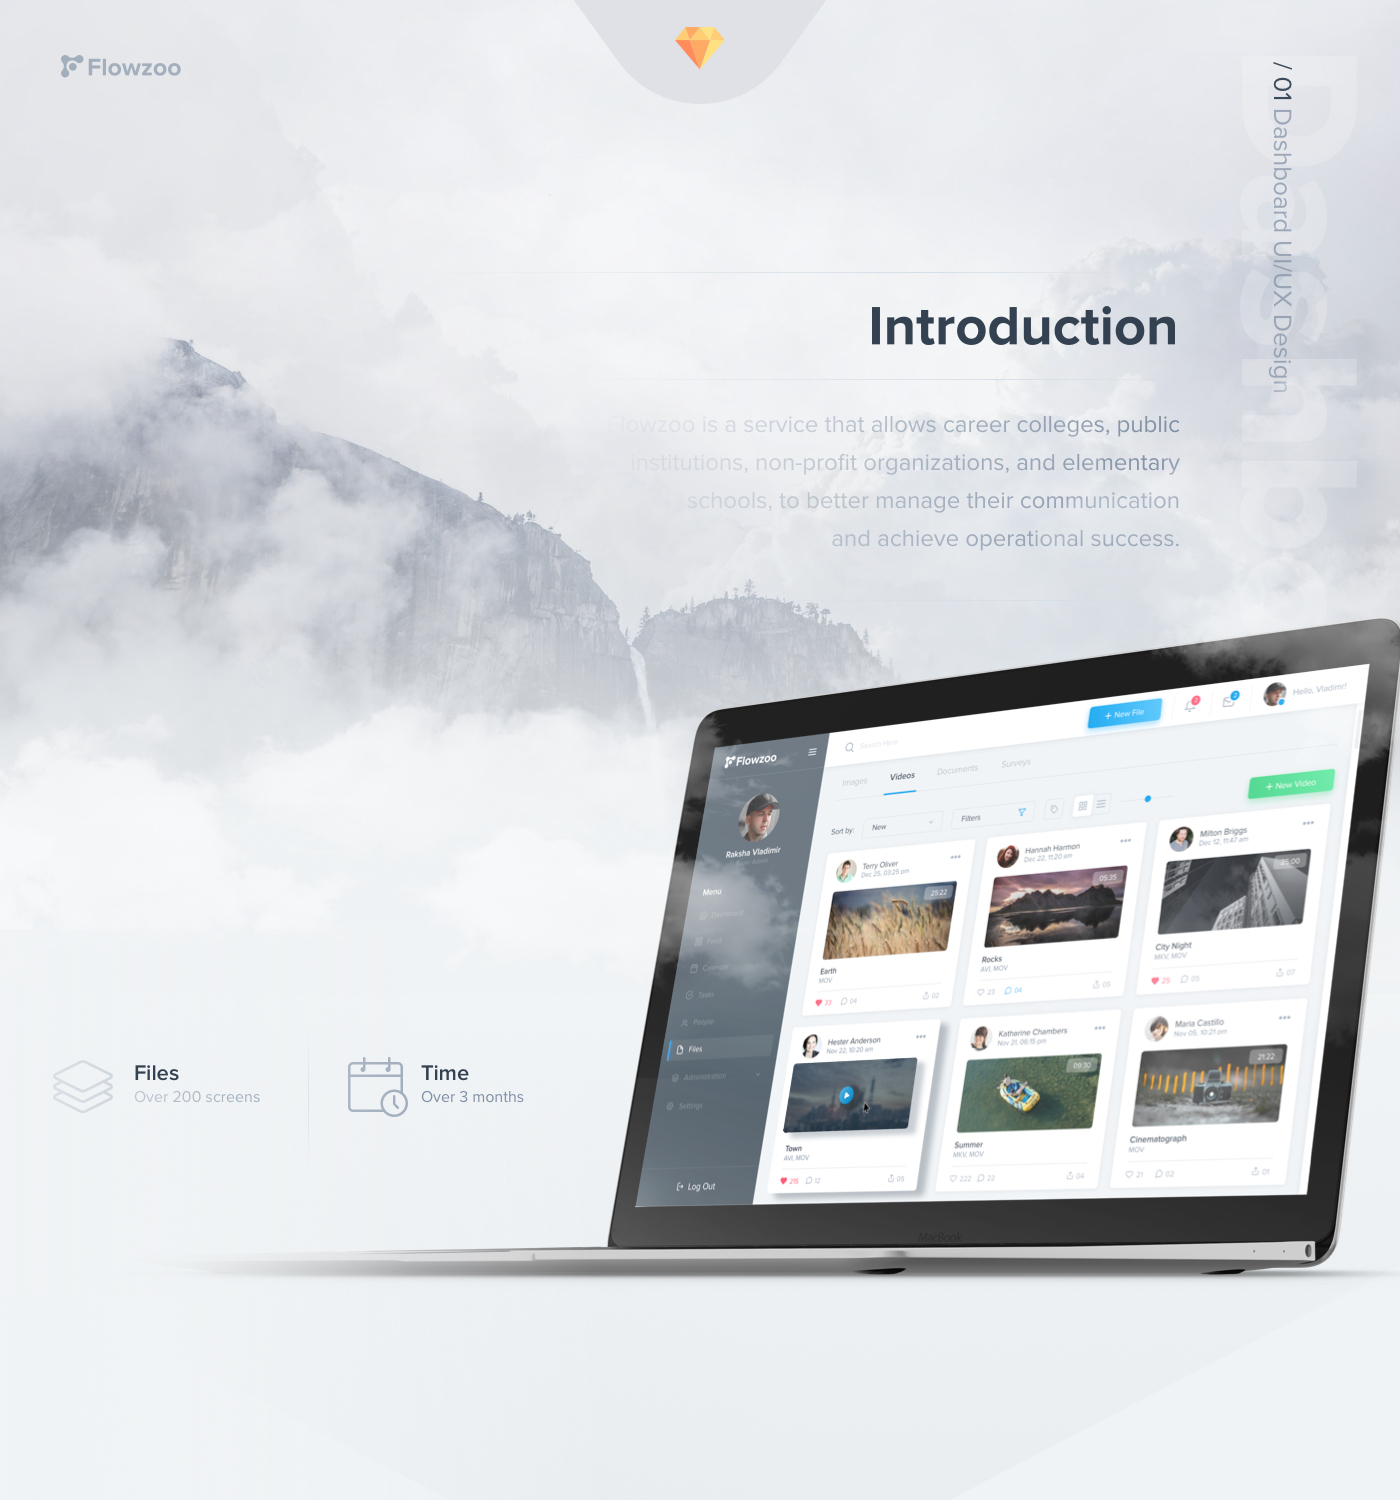
Hey, here is small part of my work for 2019, hope you enjoy it!
Dashboard dashboard graph web


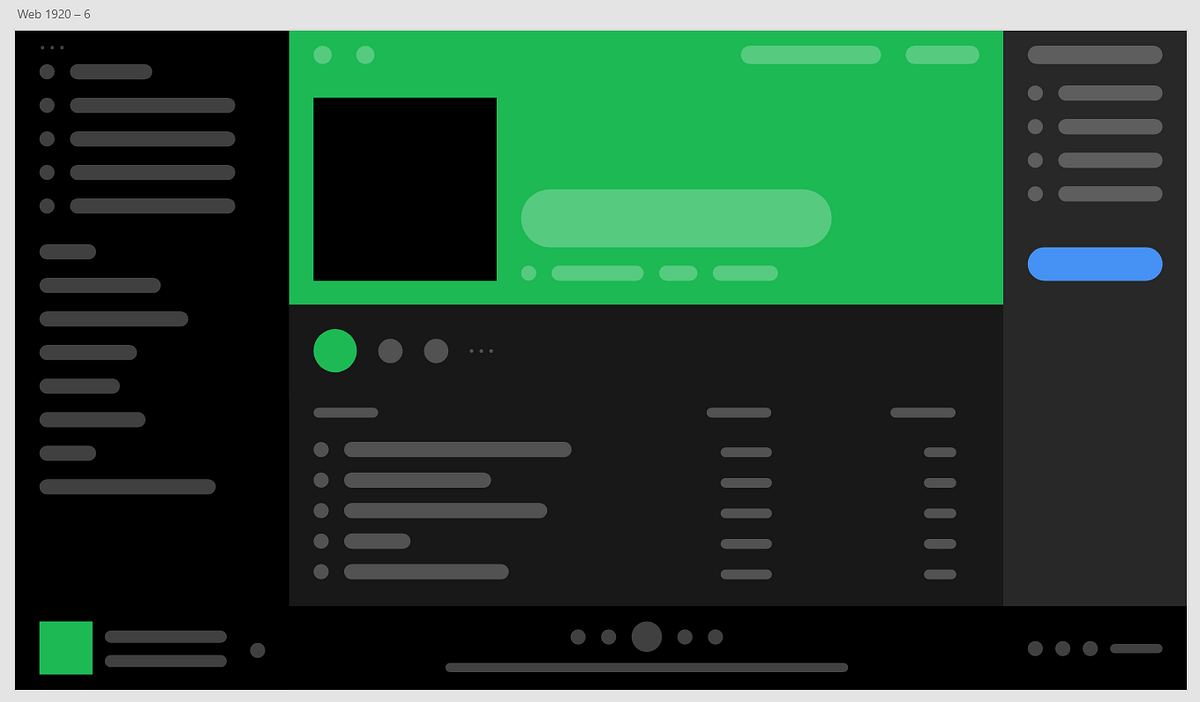
Have you ever come across one of those trendy, flat illustrations of sofware, dashboards or basically any kind of UI design there is?Well of course you have. They are everywhere. Just take a look at these awesome examples.SlackLoomI have personally designed quite a few of these for various projects, ever since I started dabbling into design. They work amazingly well as hero illustrations or maybe for showcasing features of any type of SaaS.And the best part is that they’re actually really easy to design.Well, my dear reader, today we’re going to design one of these.And it’s not just an illustration of some random, made up software. We’re going to design one based on Spotify’s desktop application.Let’s goSpotify’s user interface is quite minimalistic. There’s really not much going on, which makes it the perfect application to start with.Even if you’re not a full blown designer or illustrator, you will definitely be able to create illustrations like theses. Trust me. It’s really not that hard, and the result can be surprisingly beautiful (and useful).Now, in order to start, you want to make sure you own any of the many UI design tools out there. Here’s a few examples:Adobe XDFigmaInvisionThese are all great and works very similarly to each other. My tool of choice is Adobe XD, since it’s the one I’m the most used to working in.Design analysis & creationWe should probably start by taking a closer look at the application we’re going to base our illustration on.I’ve taken a screenshot of Spotify’s desktop application featuring the amazing album Nurture by Porter Robinson. Take a listen if you haven’t already.By looking at the design, we want to identify the most prominent features of the application, and keep those in mind while creating our illustration.You can probably think of it as a charicature.You don’t want to create a hi-fi, pixel perfect, detailed design. Instead you want to identify whatever makes Spotify Spotify, and exaggerate those features against the less important details.By taking a look at this screenshot, you will probably notice that we have 5 main sections:A dark menu to the leftA dark similar “friend activity bar” to the rightA green header section that features the albums cover art & nameA dark middle section featuring the songs of the albumA dark bar at the bottom, wrapping the main play button as well as the small cover art to the left & volume slider to the right.Mapping out sectionsWhen mapping out these sections “on paper”, I make sure to not pixel-perfectly follow the original design in terms of sizing. They can be slightly larger or smaller, depending on what you feel looks right.Perfection is for when you want to make a production ready design. This is the opposite. This is a fun illustration.After finishing our sections, we can start drawing out the shapes representing the UI elements. In this case it’s mostly text elements and buttons.The top left cornerNotice how I create icons as circles and text blocks as simple boxes. This is enough in order to keep the design as simple as possible.SpacingYou might also notice that I’m placing out small rectangles here and there. I’m using these as spacers.Even though Adobe XD provides lots of rulers and snapping points, having spacers can be really helpful sometimes in order to keep all spacing as consistent as possible.To help with this, you can also rely on some grid spacing system.In this example, I’m following a strict 5pt grid system. Every space should be a multiple of 5 (10, 15, 20 and so on). Read more about grid system in this great guide by Vitsky.Here you can see my finished structure with my UI elements and spacers:This isn’t perfect by any means, but you can already definitely see what I’m going for.That’s all for the first part. Now it’s time to for some colors.ColorsFor designs like these, we want to keep the amount of colors as few as possible. Try to identify what colors makes the application what it is, and stay close to those.For me, it’s the various shades of grey as well as the typical “Spotify green” that makes the application. This is what I came up with:“Now this looks weird” you might think.Well, yeah. We’re not done yet. Be patient my dear reader.Here’s the same design with all spacers removed:Better? Yeah, that’s what I thought.Now we just have to do a few minor changes and it will start to look really good.Here I’ve added colors to each UI element as well as rounded off most sharp corners using the radius settings in Adobe XD.Looks good? Yeah, kinda. Just some small tweaks left.And here’s the final product.The only thing I tweaked was a change of couple colors. I think it looks cool and definitely usable for some project. But you could keep working and make it way better.Here’s a couple examples:This one only has two grey background colors, instead of 4 as the one above.This one has only one grey background color. Cool.Maybe you want to do something crazy and use only the outlines? It looks like a blueprint. Looks kinda interesting.ConclusionsNow you should be able to create some really cool illustrations for your next project.These illustrations fit really well in hero sections of websites, showing off features of a software, or maybe as motion graphics for some sweet animated advertisement videos.Do whatever feels right, and most importantly: don’t try to make it perfect. Perfection is worthless.Bye,Robin 🤙Designing Minimalist Software & Dashboard Illustrations was originally published in Muzli - Design Inspiration on Medium, where people are continuing the conversation by highlighting and responding to this story.

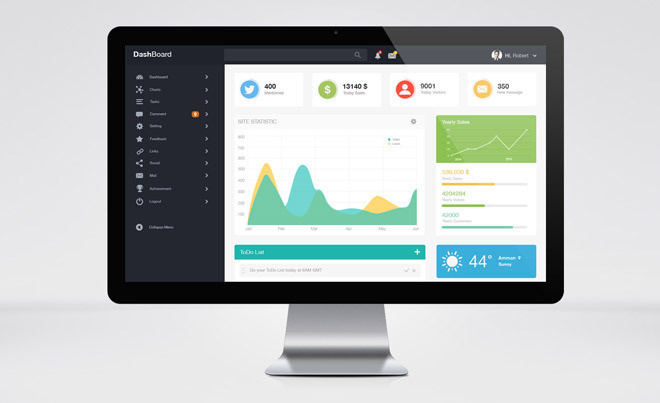
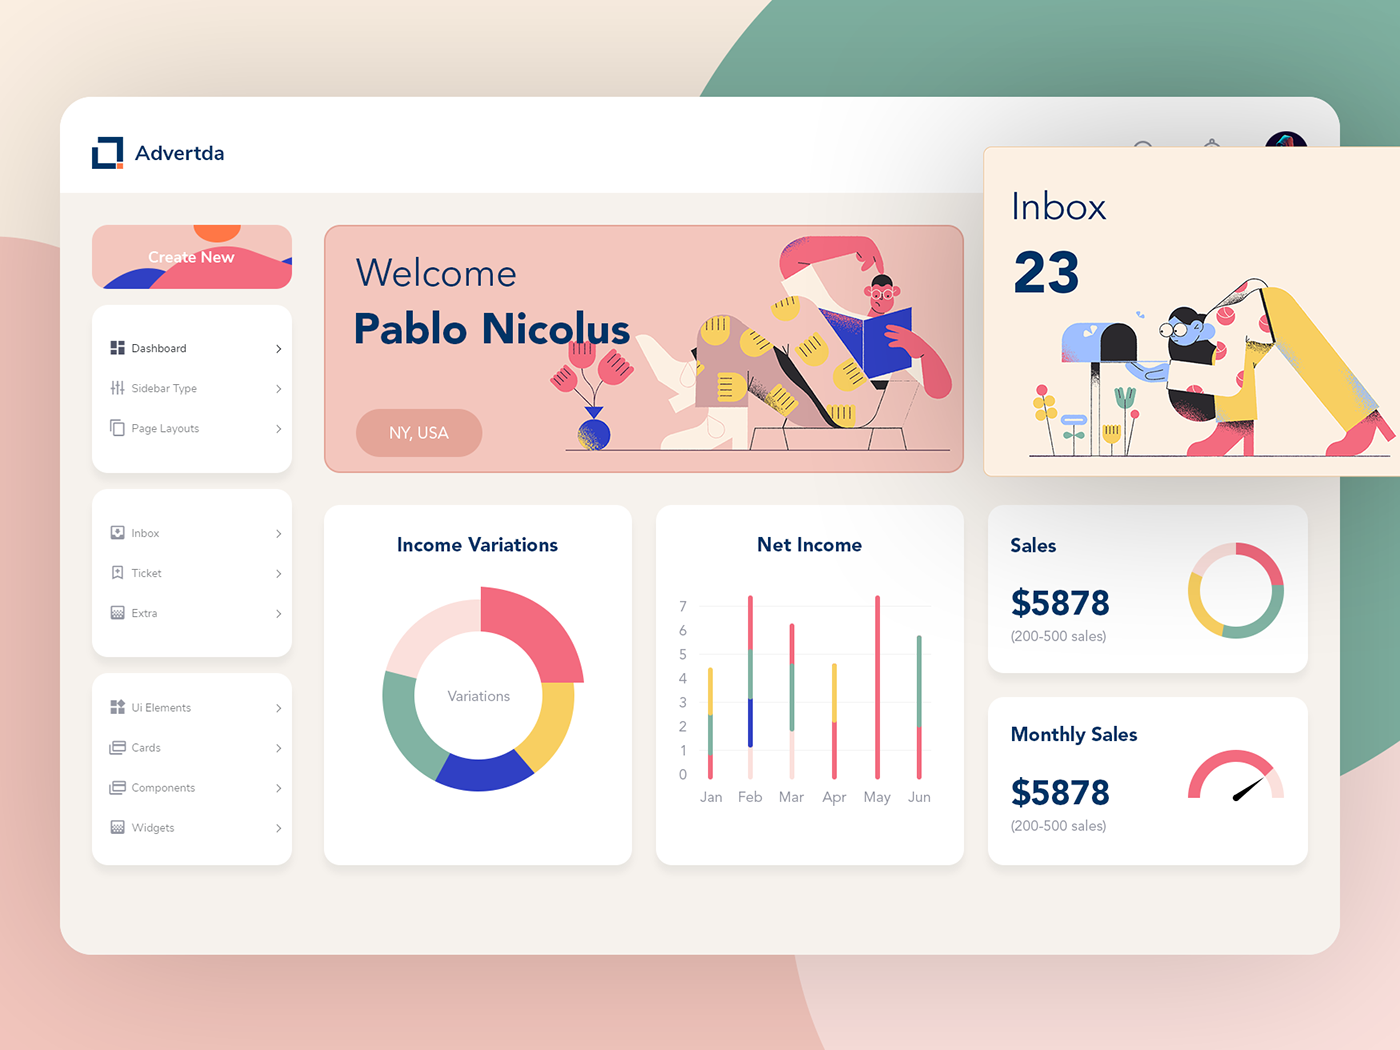
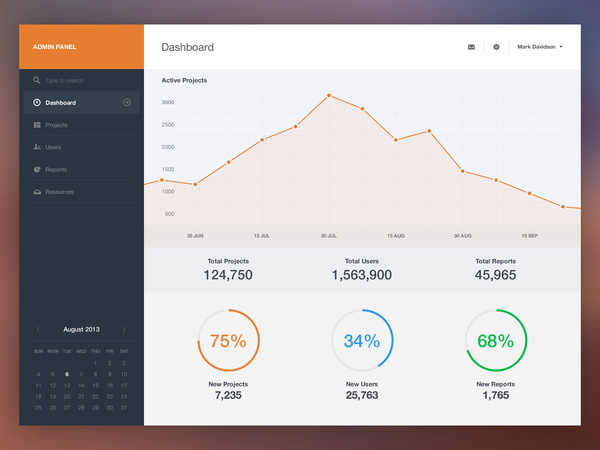
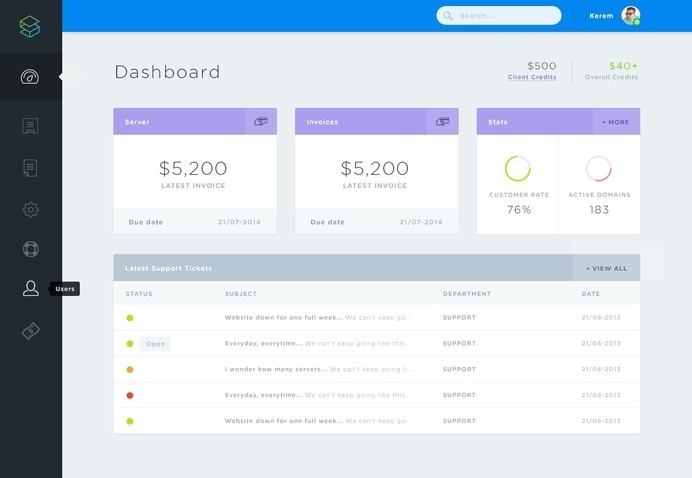
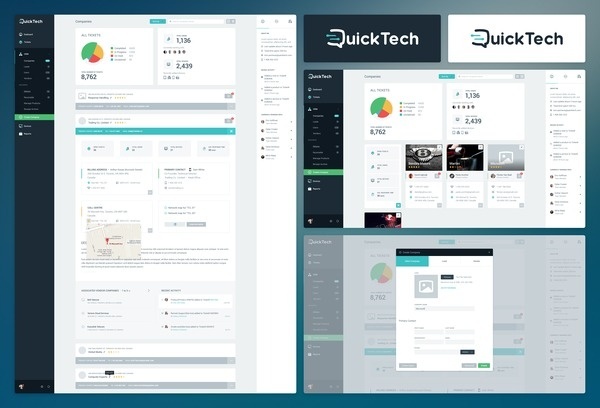
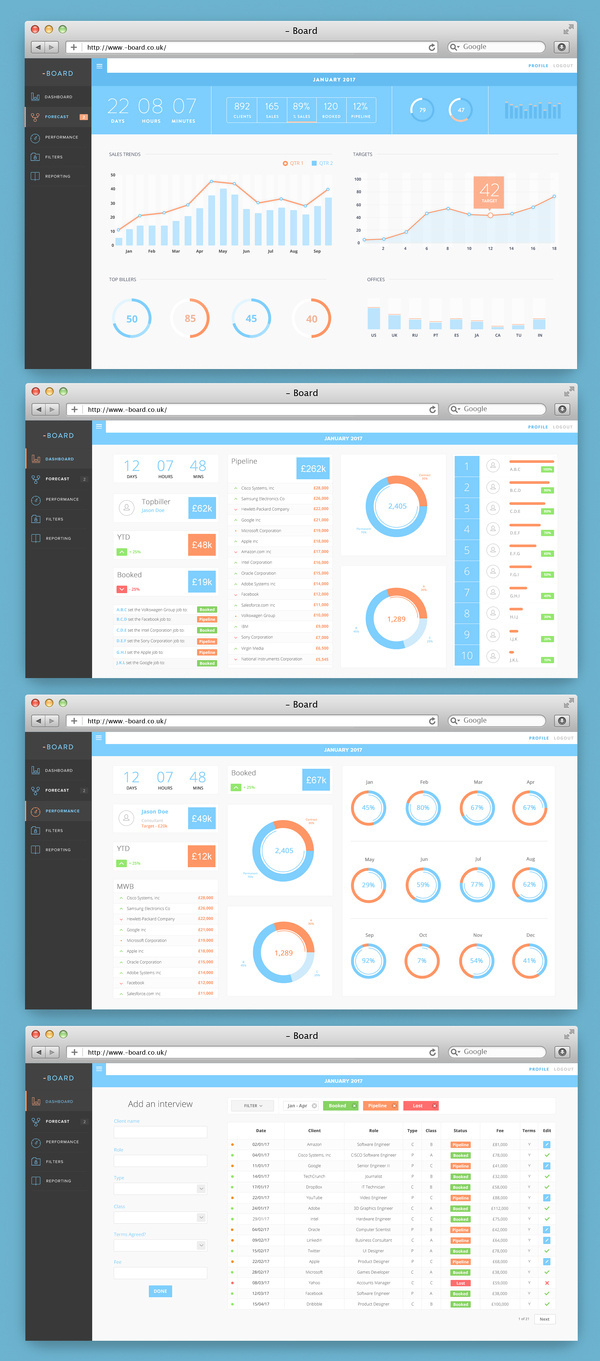
Free Admin Dashboard UI PSD Template

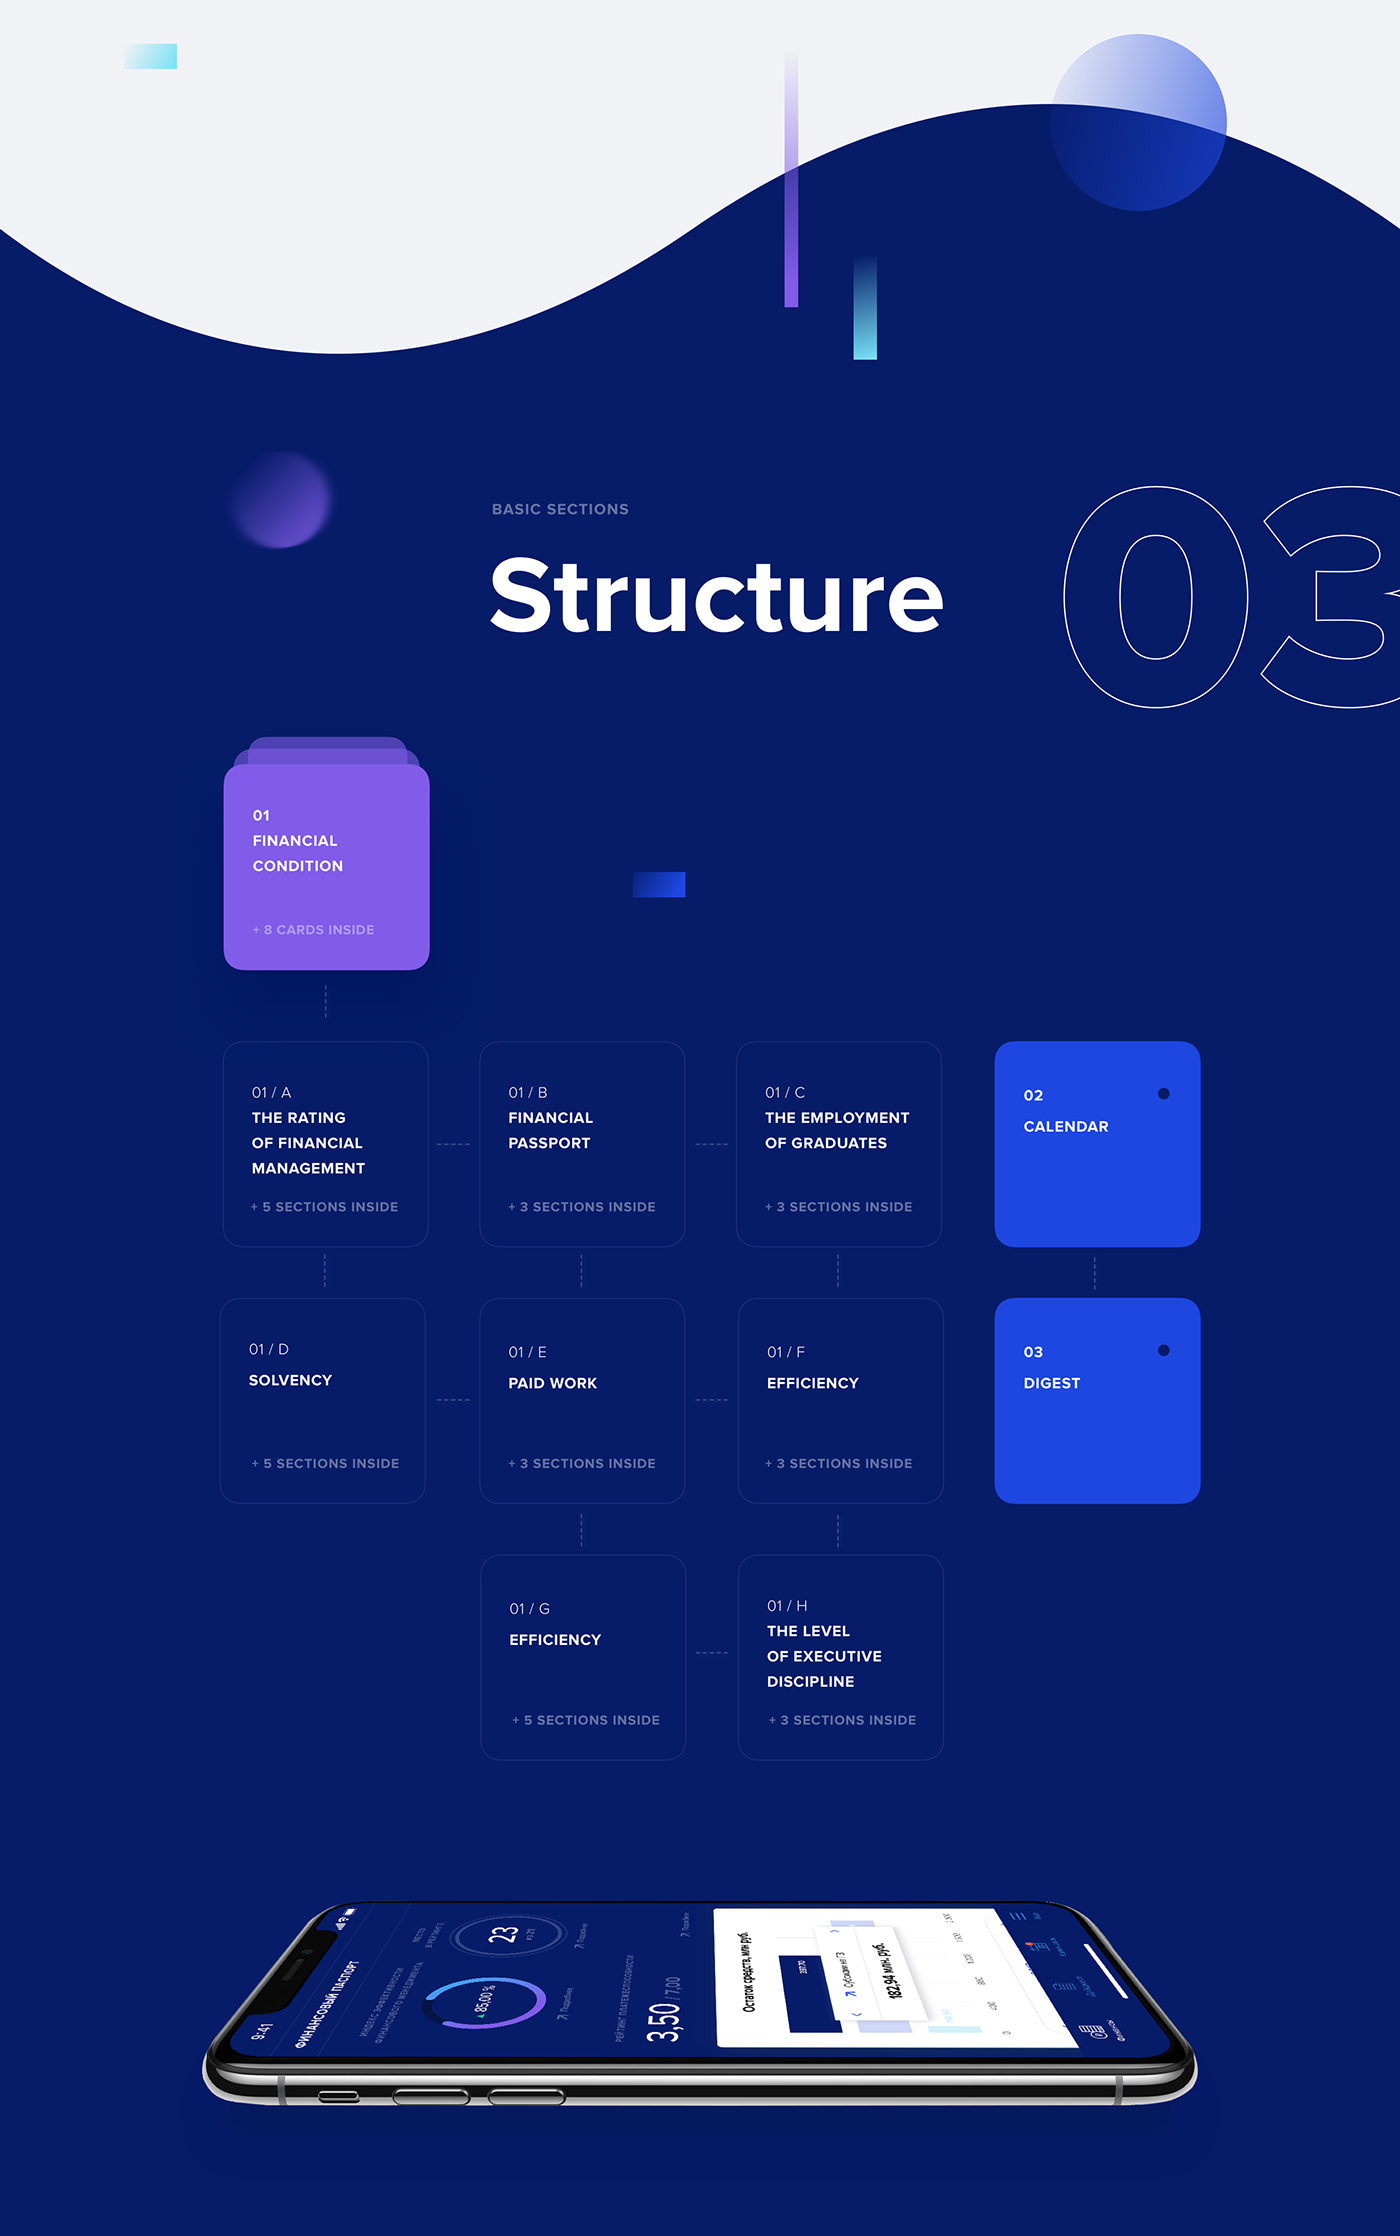
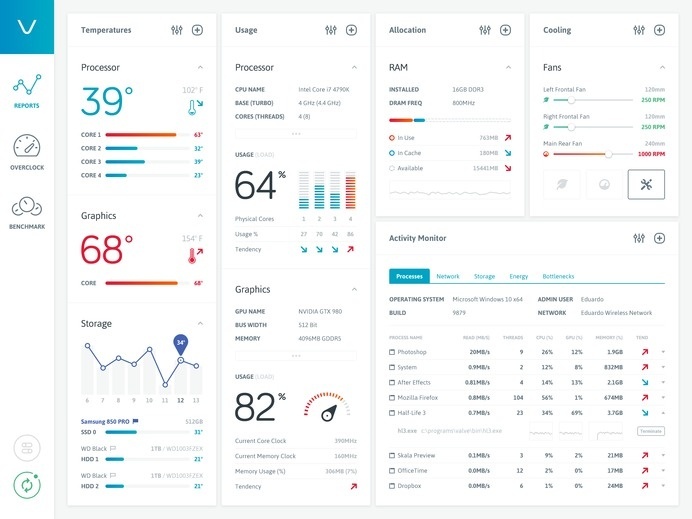
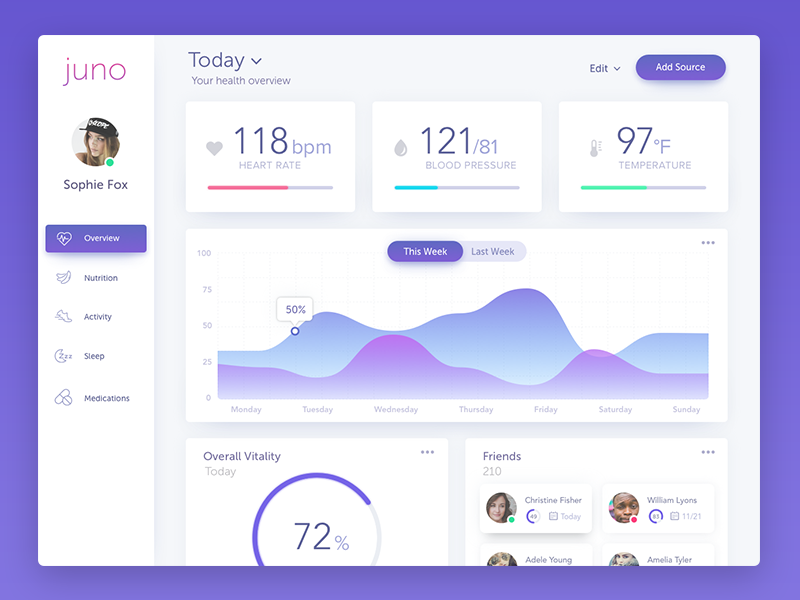
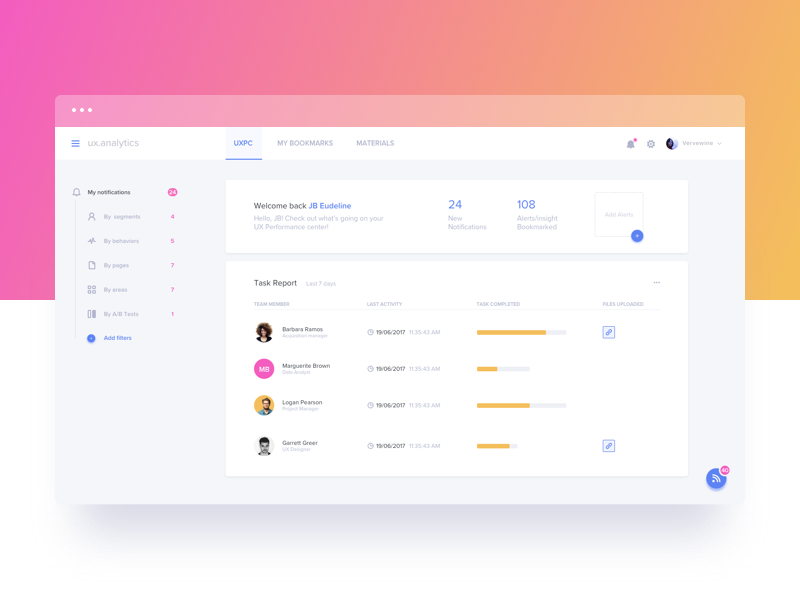
We create a finance app for employees of Russian educational institutions to obtain relevant information with an emphasis on indicators and data visualization
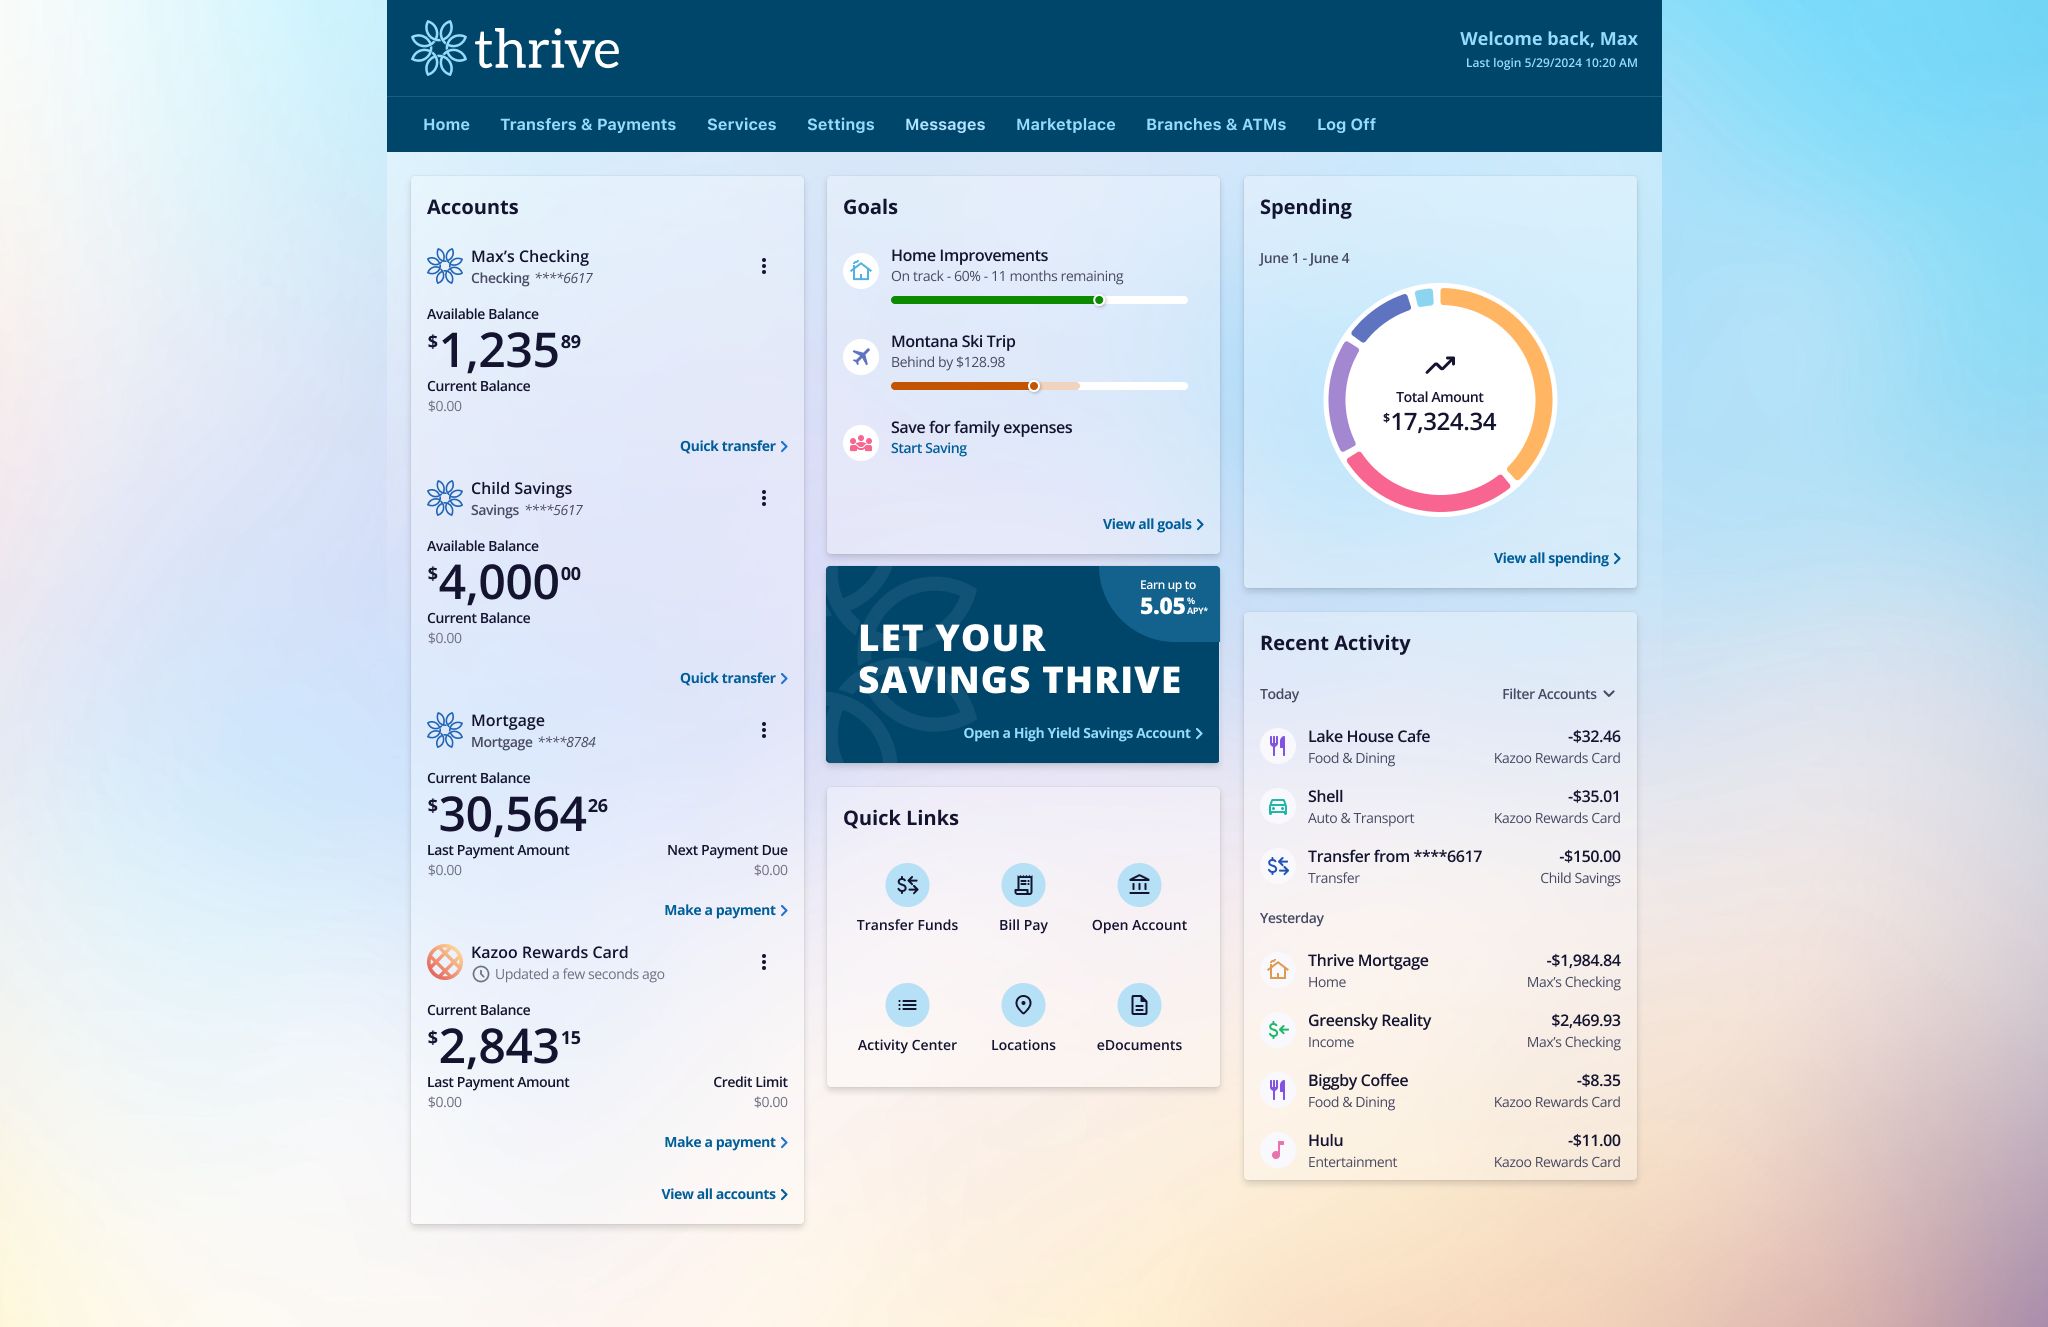
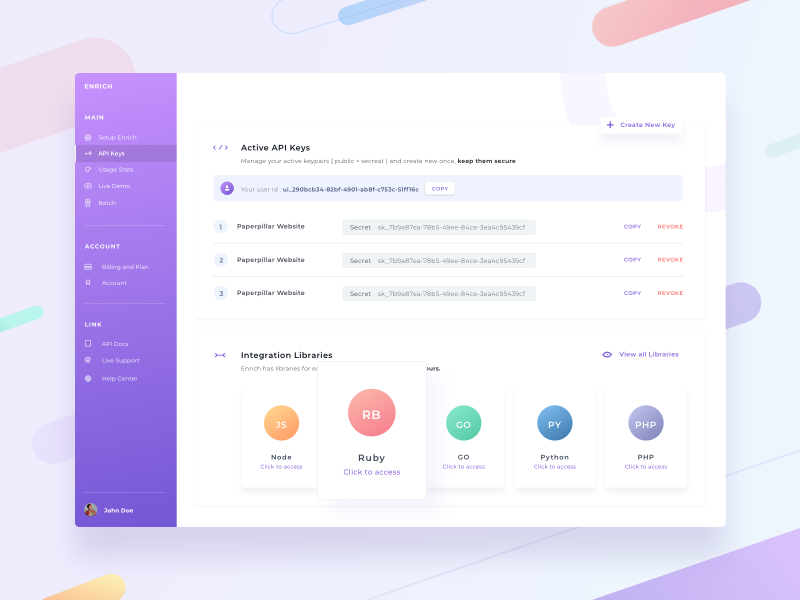
A new digital banking experience that allows financial institutions to guide the account holder’s journey using a modern user interface conf…

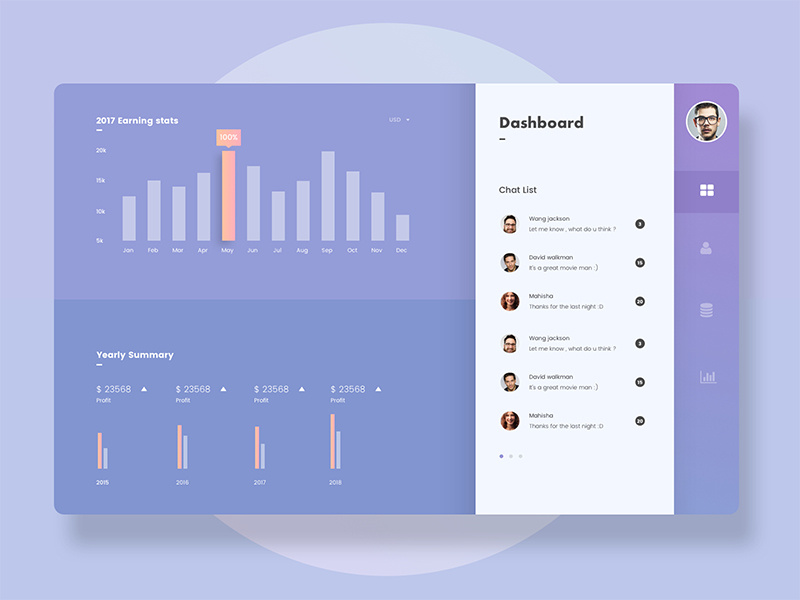
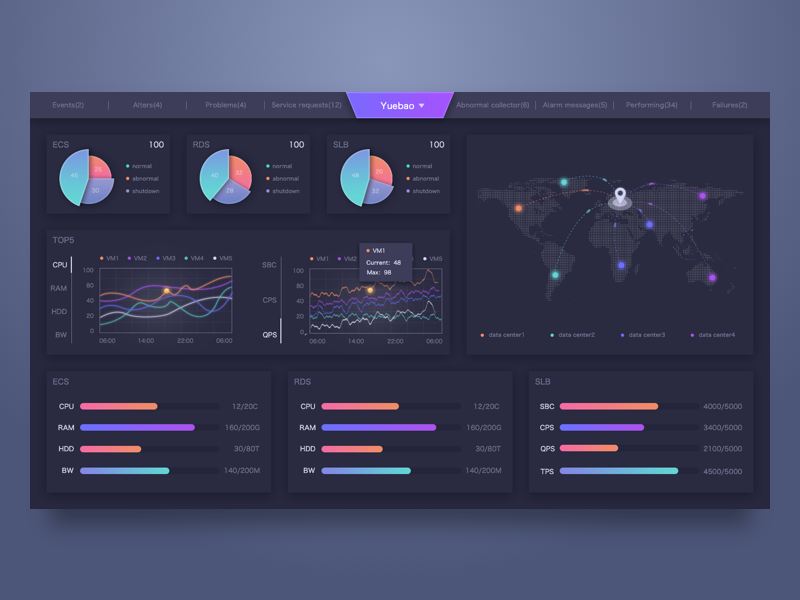
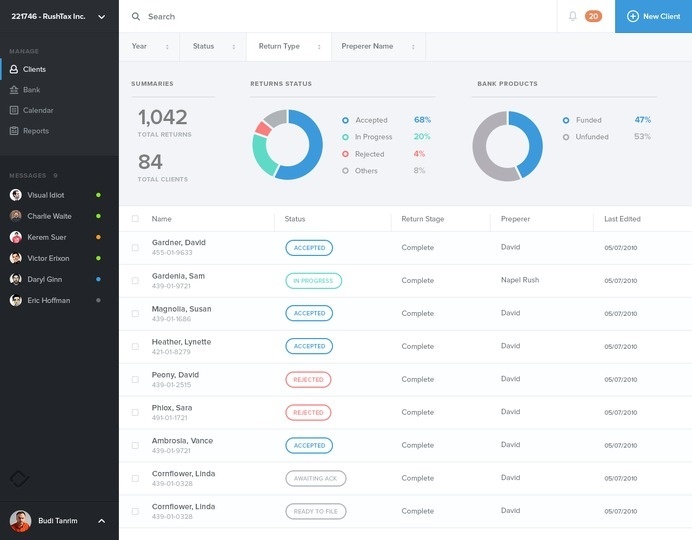
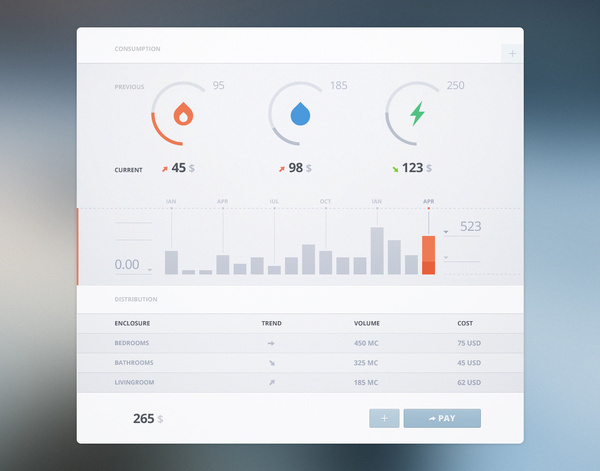
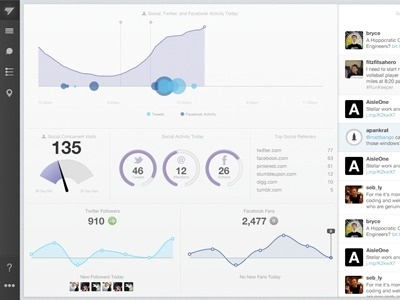
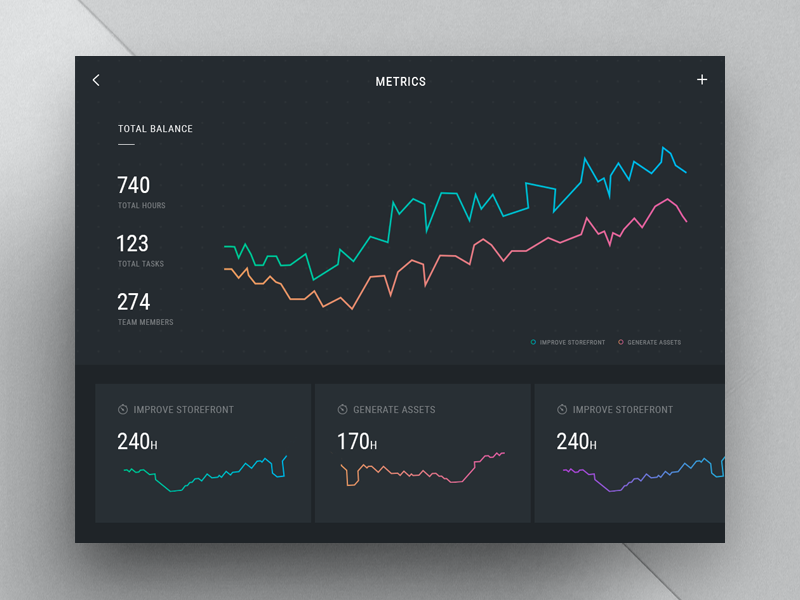
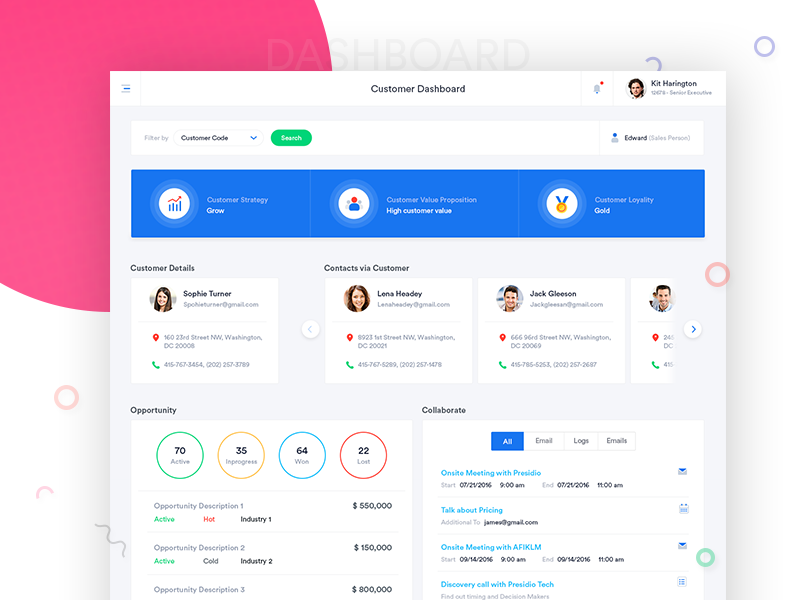
Data monitoring dashboard for a fund company.
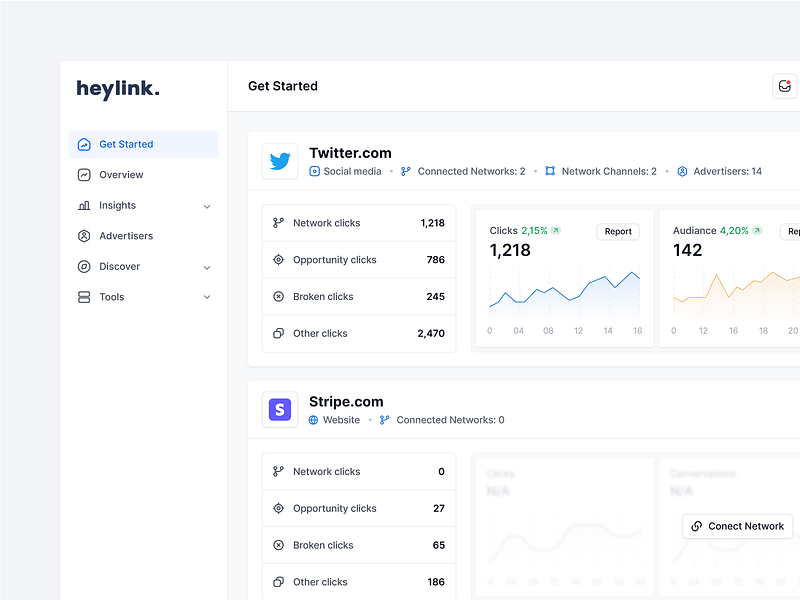
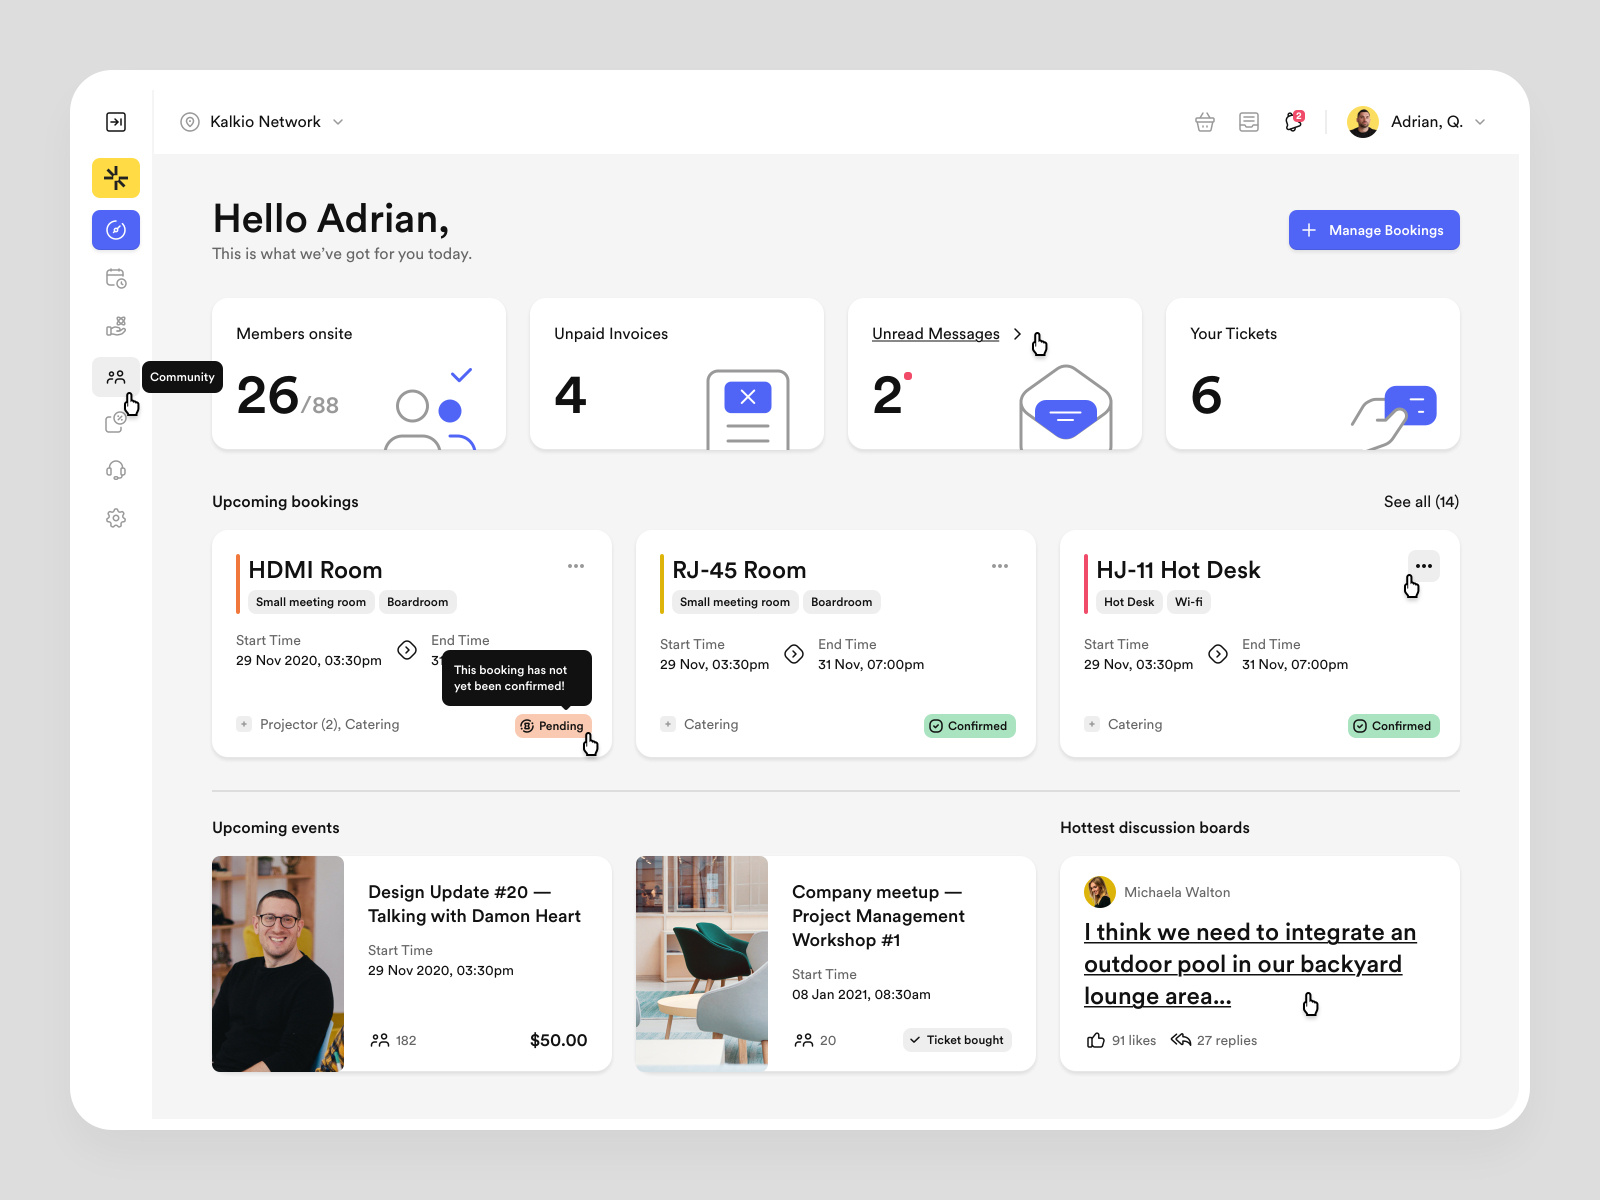
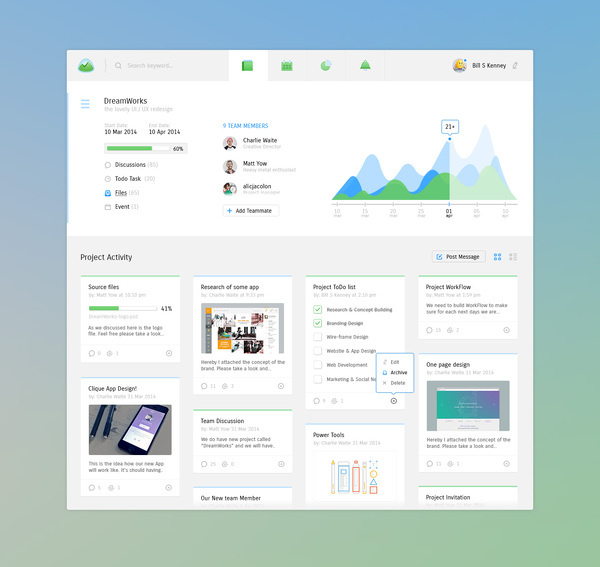
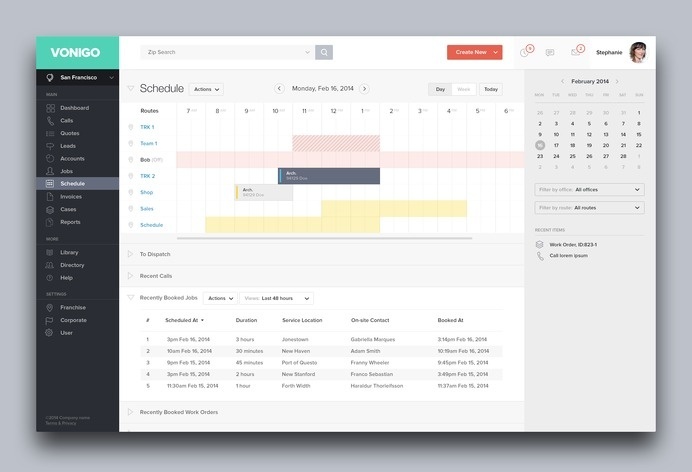
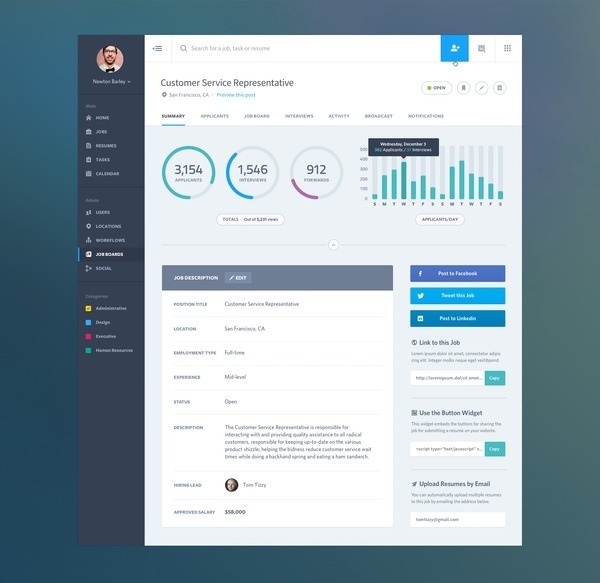
Hi folks, Sharing some new product design and development work we did for Nexudus. Here I'm sharing the dashboard home page where the logged-in user can easily see his KPIs, Upcoming Bookings, Events, and active chat rooms (discussion boards). This being a coworking space management tool, the upcoming bookings represent office spaces, rooms, desks, and seats that have been booked by your team or yourself. Nexudus Nexudus is the leading white-label platform to manage and scale up coworking spaces. It helps users automate operations, welcome members safely, enhance their community and manage daily tasks from a central dashboard. Nexudus works with 2000+ workspace operators across 90+ countries. So structuring an environment that all of those operators can call their own was no easy task. How did we help? — We overhauled user experience on primary flows. — We redesigned the platform from the smallest atom to the most complex organism. — We developed the front end of the platform using React/Next.js — We built a comprehensive Design System to help with scaling the white-label environment. One interesting point How do you define a color system for a white-label application? We managed to structure the color system where the users can brand their dashboard by picking a primary color. Our development team integrated a JavaScript function that automatically changes the text and icon color between white and black based on the contrast level of the primary color. This was done to maintain AA standards of accessibility. All other colors used in the platform are system colors that have been defined with the new design system. Services we provided — UX research — Product research — Product design — Product development — Design System build (with code) Thanks to Adrian, Filip, Anna, Rapha, and Marino for their work on the project. Big thanks to Matty from the Nexudus team for his help and guidance as we expand our partnership during 2021. Best, Filip --- We are BB Agency Digital agency building amazing SaaS websites for inspiring brands. Offering full process from branding to launch. Through challenging core assumptions, we shape the products and services that improve the lives of thousands every single day. Check us out at www.bb.agency Give BB Agency a follow below: Behance / Instagram / Facebook / Linkedin


Hi Friend 👋 I want to share my exploration about odastore dashboard animation. I hope you like it guys! ✨ Feel free to give me some feedback. And don't forget to press "L" if you love it. ---------------- We available for work together : 📩Email Us : odamastudio@gmail.com 😎Instagram : Odama Studio 🎉Figma Community : Odama Studio 🛒UI8 : Odama
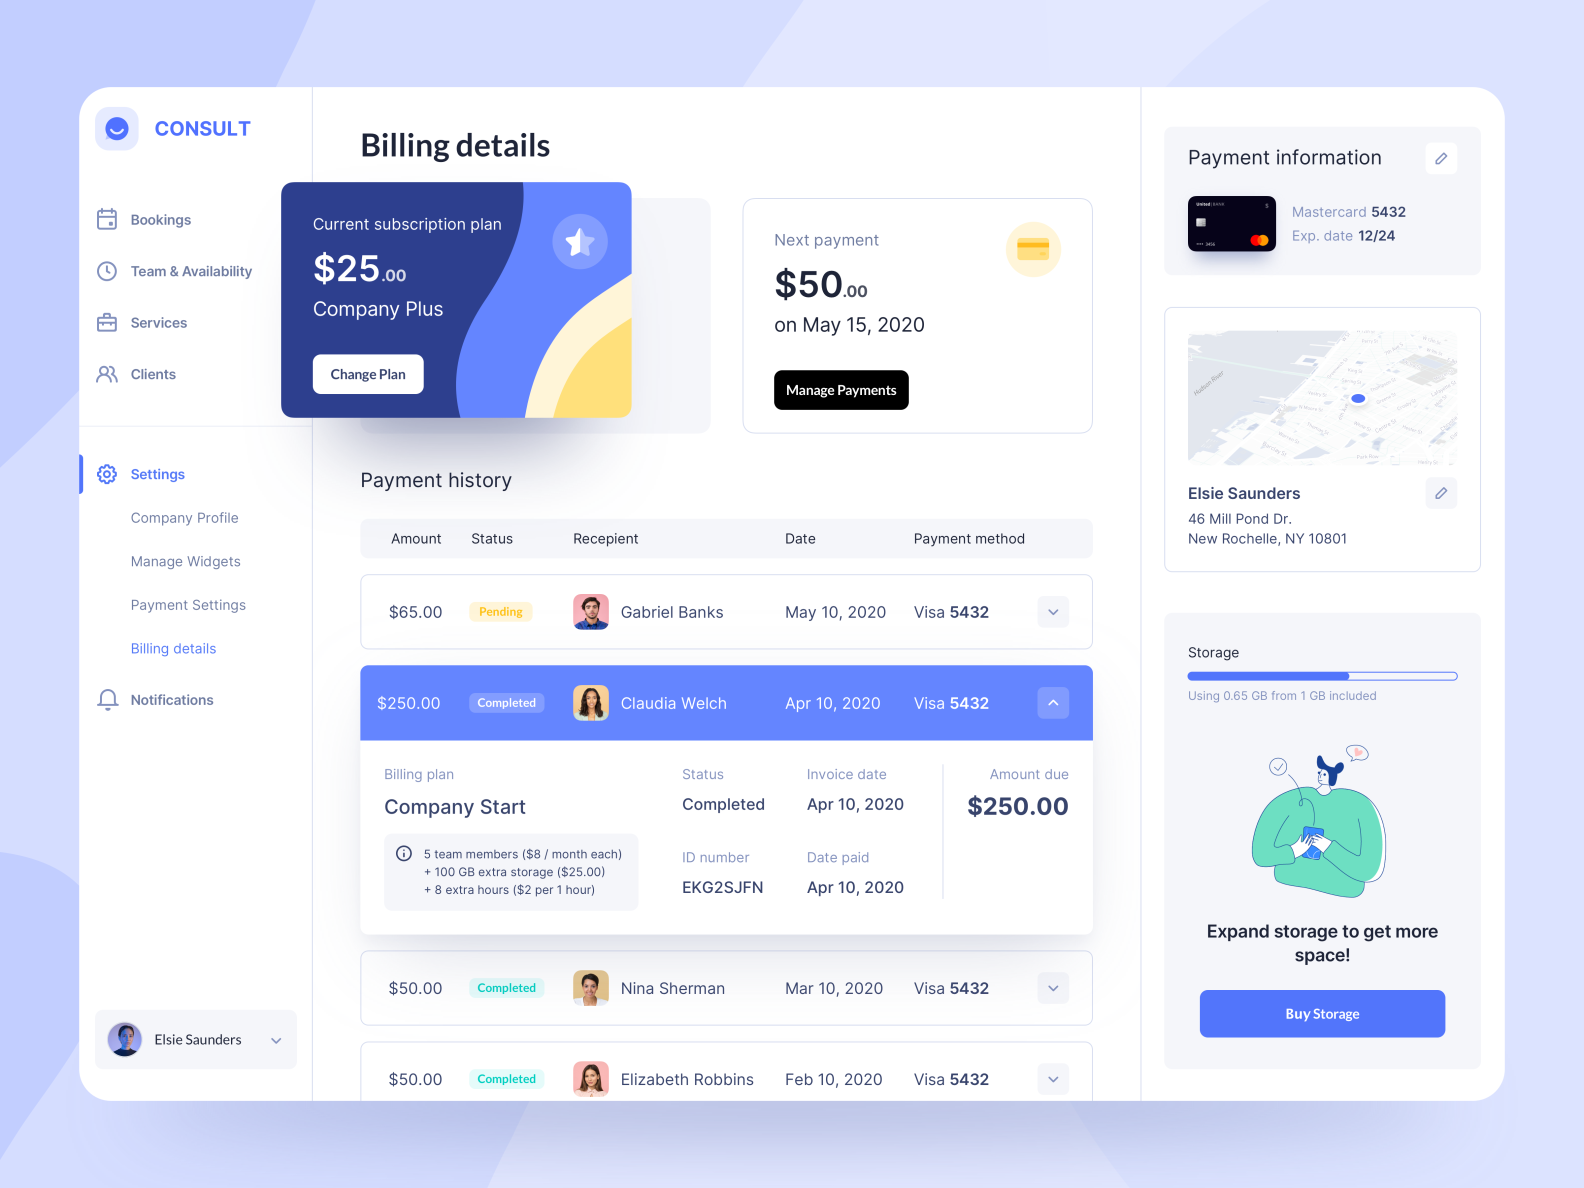
Hey there folks! Today we share with pleasure our new concept. We created this concept for an online consultations platform where users can find specialists from various fields and book a consultation directly. This page shows the billing details. Here, users can manage their subscriptions and payments with ease. Looking forward to getting your likes 🙌 UI by Victoria Subscribe for more 👇🏻 Behance | Facebook | Instagram

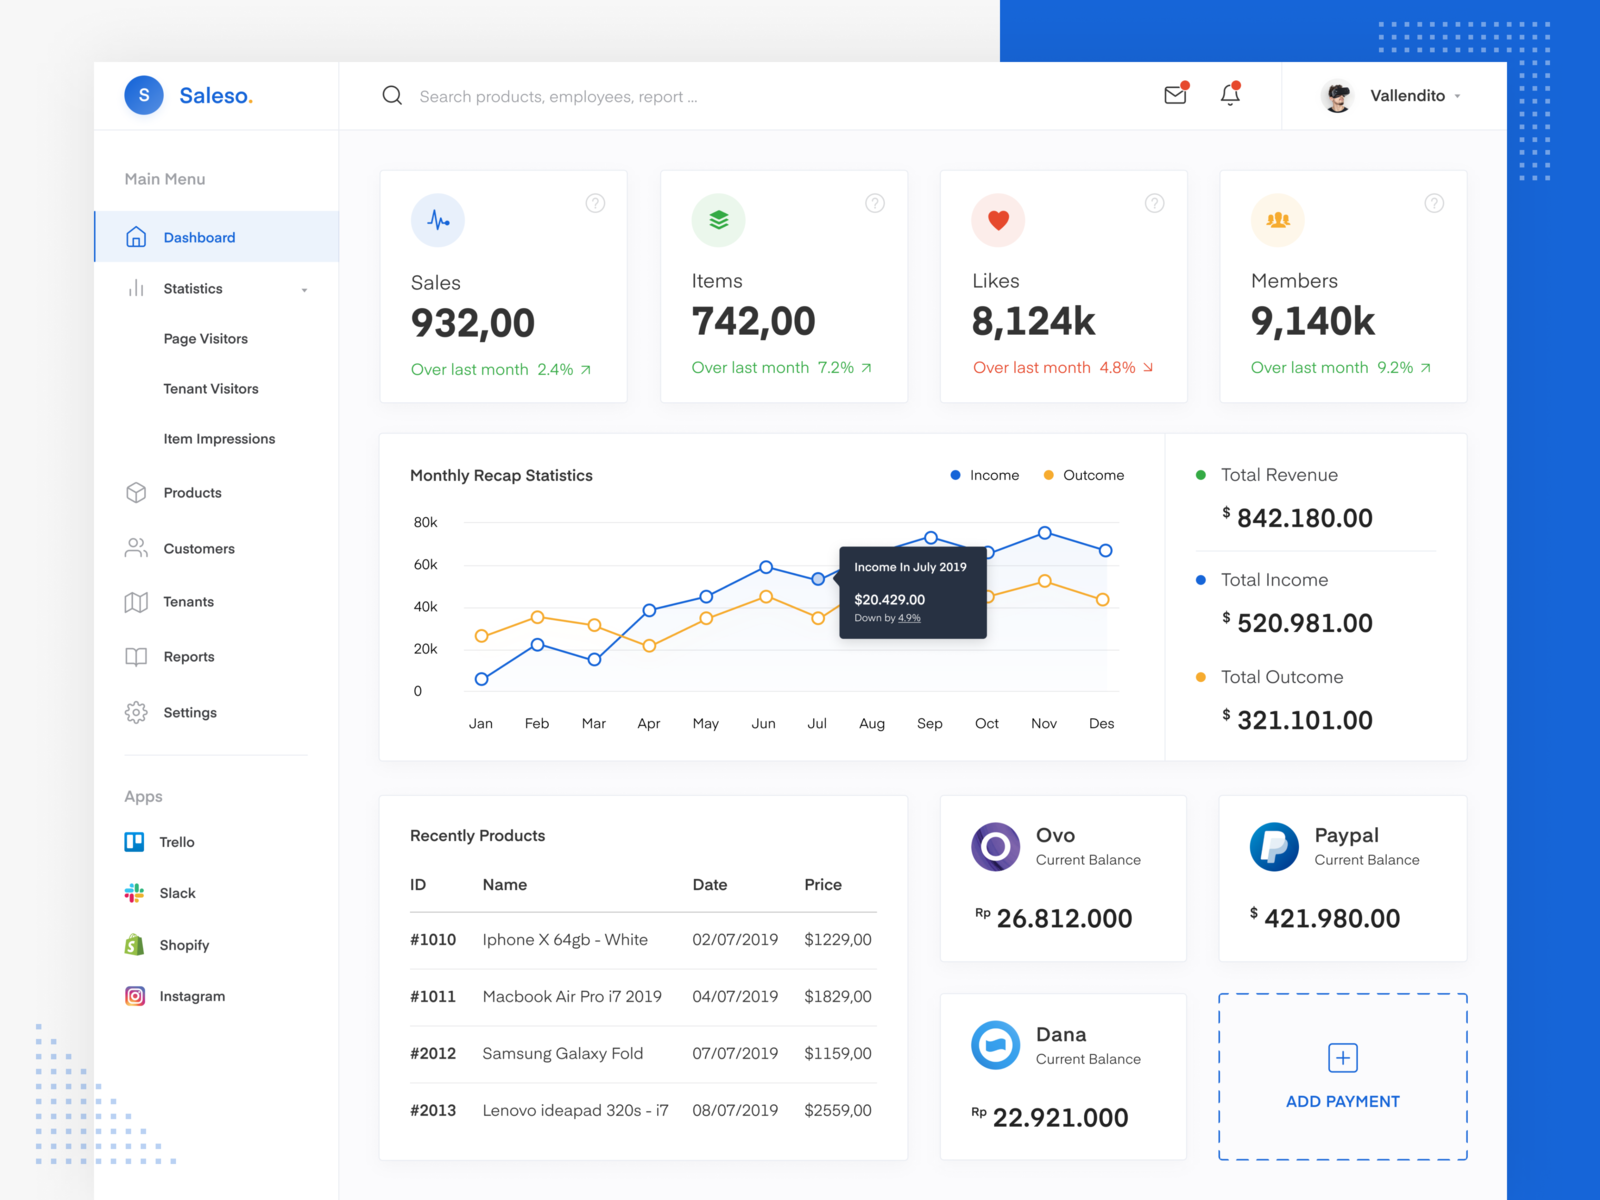
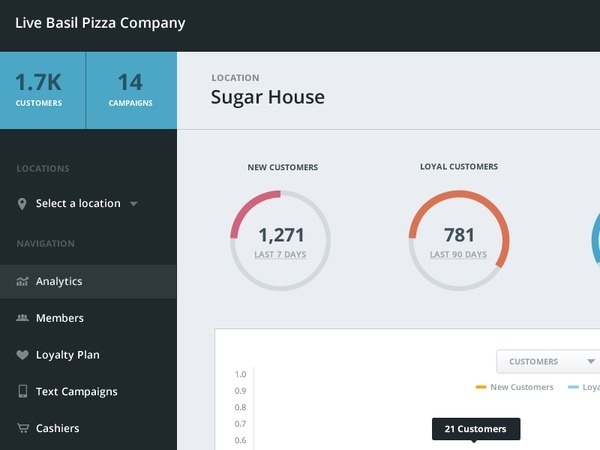
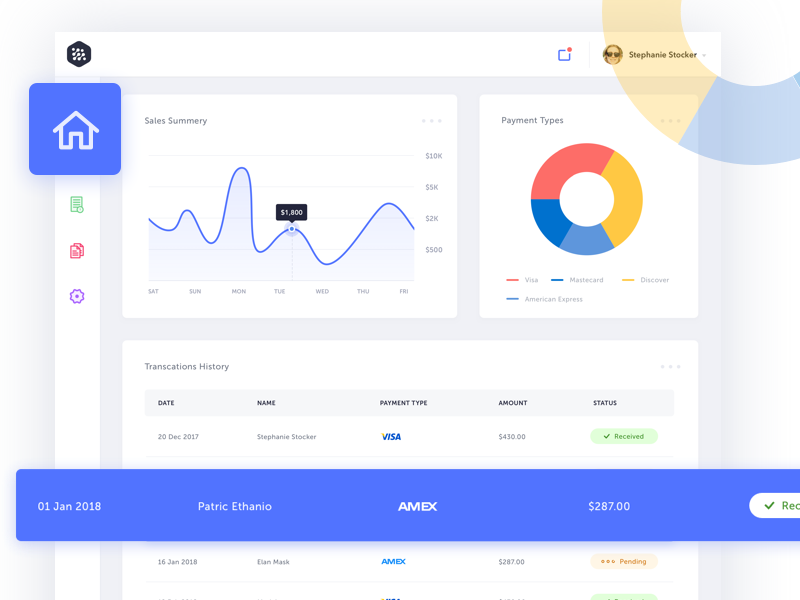
Hello Earth🏀 A few days ago I did a design for Sales Dashboard Design & try to use Figma. Finally here's the result. Let me know your thoughts guys! 😃 Please check the full version on the attachment. Don't forget to press the "Like ❤️️" button and follow our team @[1690831:Illiyin Studio] & me @[1753227:Barly Vallendito]. Thanks. ----------------- Have an awesome project and interested in collaborating with us? Connect to hello@illiyin.co


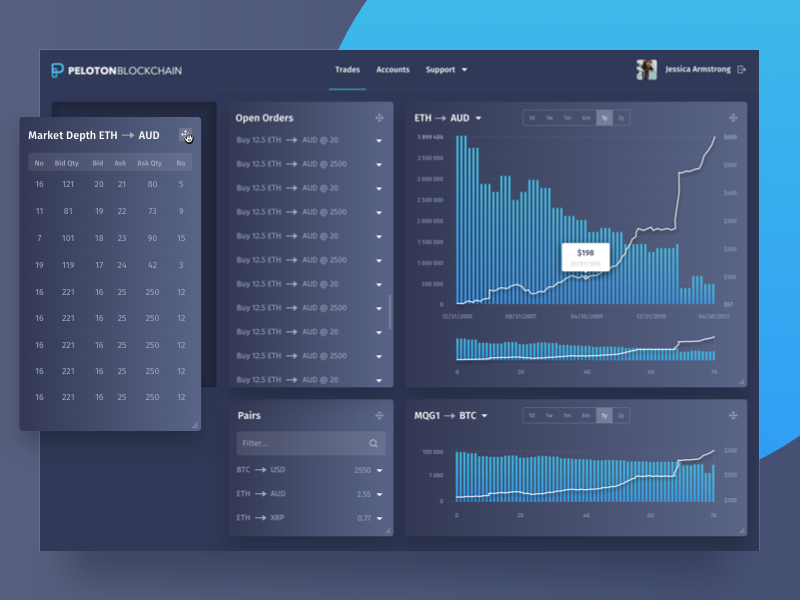
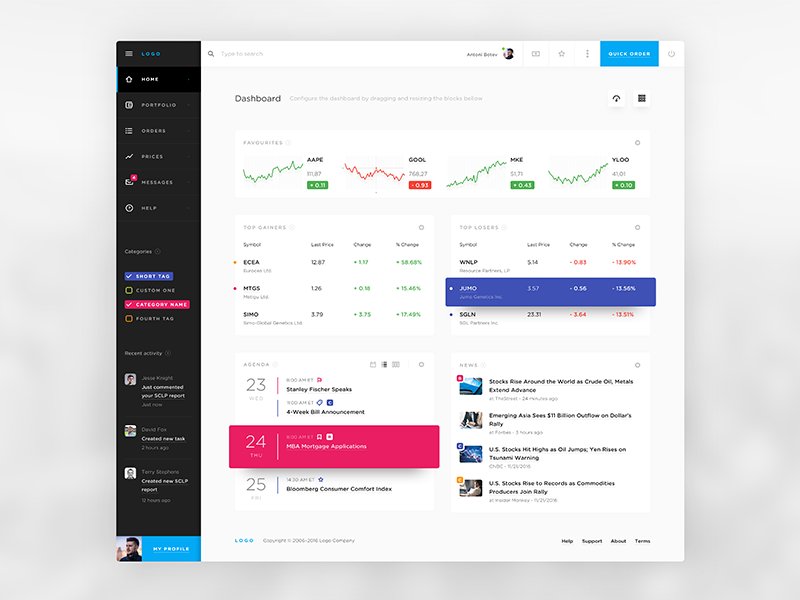
Hello! 🖐 Here's just a small part of our trading platform dashboard project for Peloton Blockchain. We'll keep you posted! 👨💻 Follow me on Instagram! 💙 --- Press "L" to show some ❤! We're available for new projects: design@elpassion.com EL Designs | Website | Medium | Facebook | Twitter | Instagram We're hiring in Poland! Apply: career@elpassion.pl

Don’t forget to ❤️ Press “L” to support the shot
Get access to thousands of freshly updated design inspiration pieces by adding Muzli to your browser.
Loved by 800k designers worldwide, Muzli is the leading go-to browser extension for creative professionals.